Nebula text: WebGL experiment
When I was doing the Tree Generator, I used dat.gui for the first time, and on their workshop they have the following text to play with:
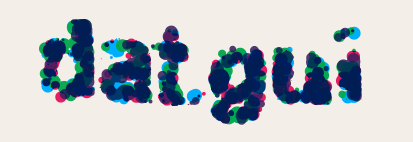
dat.gui -
This gave me the idea to render text on the canvas using particles that would seem to be gravitating around, in such a way that when seen all together you would see the text.
Example: “hey”
Click for explosions
For this example I set a big drag force so that the particles would settle fast and you could read the text more easily. On larger sizes it actually looks better withouth any drag force.
Demos
- Main demo: Sample demo with dat.gui controls to play with the settings.
- Music Nebula: Nebula instance synced with an audio track for explosions.
First steps
I initially did this experiment on the canvas without any rendering engine. This has the advantage of rapid prototyping, and the disadvantage of likely performance issues. I managed to make it work quite well though, but the number of nodes it could render was limited by the browser JavaScript interpreter.
The basic idea is to have a number of particles gravitate towards a point, in such a way that the points represent the text:

edges - Points around which the particles gravitate.
This was actually trickier than it seems, because there is no built in way to get a list of coordinates like that. So I did the following:
- Create an empty canvas for processing.
- Using
ctx.measureTextfind the largest font size that fits it. - Use
ctx.fillTextto write the text, using white on black for better contrast. - Read the canvas pixels line by line, looking for white pixels. When found, set up a new particle gravitating towards it.
In order to allow for different resolution settings I didn’t go pixel by pixel, instead I set up increments of resolution pixels, then calculated the average color of them, and compared that to my tolerance threshold.
The code for this is quite long, so I posted here the relevant parts only:
// Find the largest font size
var textSize;
do {
    canvas.ctx.font = "bold " + content.size + "px sans-serif";
    textSize = canvas.ctx.measureText(content.text);
    content.size++;
} while (textSize.width < canvas.WIDTH && content.size < canvas.HEIGHT);

// Now sweep the canvas finding the text
var pix = canvas.ctx.getImageData(0, 0, canvas.WIDTH, canvas.HEIGHT);
for (var y = 0; y < pix.height; y += nebula.settings.resolution) {
    for (var x = 0; x < pix.width; x += nebula.settings.resolution) {
        // Calculate averages
        var found = false, auxAvg = 0, points = 0;
        for (var x1 = 0; x1 < nebula.settings.resolution; x1++) {
            for (var y1 = 0; y1 < nebula.settings.resolution; y1++) {
                // I now have all needed pointers
                // Get the index inside pix array
                var pixIndex = ((y + y1) * pix.width + x + x1) * 4;
                auxAvg += (pix.data[pixIndex] + pix.data[pixIndex + 1] + pix.data[pixIndex + 2]) / 3;
                points++;
            }
            auxAvg = auxAvg / points;
            if (auxAvg > 0 && auxAvg < 255 - (255 * nebula.settings.tolerance)) {
                // Found a valid point
                break;
            }
        }
    }
}
With all this code I have the image before, with all the edges. Now it’s just a matter of drawing some particles in random locations, and update their position based on gravity towards the calculated points.
Here is a live example where you can see the distance from each particle to the point where it wants to go (green), and the force (red):
For this example I set the drag force to 0 so that they would remain moving. Most of the particles’ behavior can be changed with the settings, which allows for pretty cool effects.
On the demo page for Nebula you can play with these settings using dat.gui.
Interesting uses
After playing with the explosions for a while I realized it would be really interesting if I could sync them to an audio track.
Looking around I found out that Chrome and HTML5 provide an AnalyserNode that does an FFT on the audio and gives you the frequency analysis, so I decided to hack that and Nebula together for an awesome visualization experience!
Setting up the analyser was just too easy:
window.AudioContext = window.AudioContext || window.webkitAudioContext || window.mozAudioContext;

// Remember to add this to the HTML:
// <audio id="explosions" src="misc/dubstep.mp3" preload="metadata"></audio>
var audio = document.getElementById('explosions'),
    audioCtx = new AudioContext(),
    analyser = audioCtx.createAnalyser(),
    source =  audioCtx.createMediaElementSource(audio);

// Connect the analyser to the source
source.connect(analyser);

// And then the analyser to the destination, if you don't
// you will analyse the audio but not hear it.
analyser.connect(audioCtx.destination);
analyser.smoothingTimeConstant = 0.3;
// FFT "resolution", this specifies the number of samples
analyser.fftSize = 512;

// Setup frequencyData to hold our information
var frequencyData = new Uint8Array(analyser.frequencyBinCount);

// Not necessary since I set it to autoplay
// left it here in case someone copies this code.
audio.play();

// There are different ways to do this, but requestAnimationFrame works great
function animation() {
    requestAnimationFrame(animation);

    analyser.getByteFrequencyData(frequencyData);

    // And here I have the frequency data
    console.log(frequencyData);
}

// Start the process
animation();
The snippet before gives us the array frequencyData, which will contain in this case 512 integers [0, 255] representing in lay man’s terms the “volume” on each frequency.
Using this it’s easy to set up a function that iterates over each frequency, checks if the volume is bigger than a set threshold and if so, triggers an explosion.
The problem is that most songs are just centered on a low range of frequencies, so in order to have an accurate explosion on each frequency we would need a very big FFT resolution and then take only the first 300 values or so. Since that would be a bit resource intensive, and I only want an interesting visual effect I distribute the explosions randomly whenever any frequency surpases the threshold. At the moment there is no way to set a frequency range on the AnalyserNode.
Here is the function for this:
// This function should be called where 'console.log' is in the other snippet
function frequencyExplode(freqData){
    var total = freqData.length;

    // Divide by 2 because half the data is always 0
    for(var i=0; i<total/2; i++){
        if(freqData[i] > musicSettings.freqThreshold){

            // Random location in the x axis. Without the part after
            // the + the explosions would have been exactly on the frequency
            // they should, but as I said that wouldn't work fine because of
            // the spectral distribution of music. Will improve this over time.
            var x = $(document).width() * i / (total/2) + $(document).width() * Math.random();

            text.explosion(x, $(document).height()*Math.random());
        }
    }
}
Turn up the volume, and take a look at the demo :)
Related Posts
Building a full SaaS app in days
How I built a complete clinic management system using LLMs in a fraction of the usual time
dotdot: A social experiment
Group chat application aiming to help meet and get to know other people
Procedural Map Generation
JavaScript implementation using simplex noise and WebGL rendering
Flocking Behaviour Simulations
JavaScript implementation of the Boid algorithm
Using the latest front-end tech
Sample web I've coded to get the latest front end technologies working together.